Color Blind Image Checker
Choose a PNG, JPEG, or WebP image from your device. You can also paste a screenshot while the Image panel is open or drop a file onto the preview. Try the sample chart first if you want to see the controls in action. The color blind checker opens both versions at the same scale so you can compare one detail in the same spot.
Start with the information someone needs to read. In a chart, that could be the two lines that pass close together. In a form, look at the error border and the label beside it. In a map, check whether neighboring areas still look different enough to match them to the legend. Zoom in when the important details are small, then reset the view before checking the whole image again.
Use Original lens to show part of the original over the simulated image. Inverse lens puts the simulation inside the circle. These views work well for a small icon or overlapping lines. Switch back to Side by side when you want to compare the overall layout. Download the simulated view as a PNG when you need an image to refer to during revisions.
How to Use the Color Blindness Checker
Pick a view that matches the colors you want to inspect. The color blindness simulator includes red-, green-, and blue-related modes. The weak settings model a different degree of change from the full settings. Start with Green blind or Red blind if your design uses red and green to separate statuses. Try Blue blind if you need to distinguish several areas that depend on blue and yellow. Grayscale gives you a quick way to see which parts differ mainly in their hue.
Run the color blind checker on two versions of the same design. Keep the first version open locally or download its simulation, then load the revised image in the same mode. Check the elements you changed first. A chart with line labels or two dash patterns often becomes easier to follow even when the colors start to look similar. The two sample charts illustrate that difference with the same underlying data.
Color Blind Accessibility Checker for Palettes
Open Palette when you know the colors already. Edit a swatch with a color picker or enter its value in HEX, RGB, HSB, or Lab. The palette displays the original and three simulated rows. Read the pair hints to see which colors are close in a modeled view. If a pair is only decorative, it may need no revision. If each color identifies a distinct category, try adding visible labels, a pattern, or different shapes.
Download the palette as an ASE swatch file or a JPEG card. You can also copy a link that contains the palette name and color values so someone else can reopen it.
You can also select Pick colors in Image mode to sample two pixels from an image and send them to Palette. Try sampling the middle of a solid text stroke and its background for a simple contrast check. Smoothing at letter edges, transparency, and gradients can give you different readings from one pixel to the next. If you know the actual foreground and background values, enter those directly and check the pair in context.
Check Text Contrast Separately
The color blind checker shows the ratio for the two original palette colors you select. WCAG 2.2 calls for at least 4.5:1 for most regular text at Level AA and 3:1 for large text. These thresholds apply to text and its displayed background. A pair can have enough contrast for text and still be a poor choice for two categories in a color-coded chart. Use the ratio for readability and the modeled preview to see where color distinctions may blur.
Changes Worth Checking Again
The color blind checker is most useful when you can point to a specific task. Can someone follow a route on the map? Which bar represents their group? Does the form identify the field with the problem? Add the information close to where it matters. A short label beside a status dot can do more for a reader than another shade of the same color.
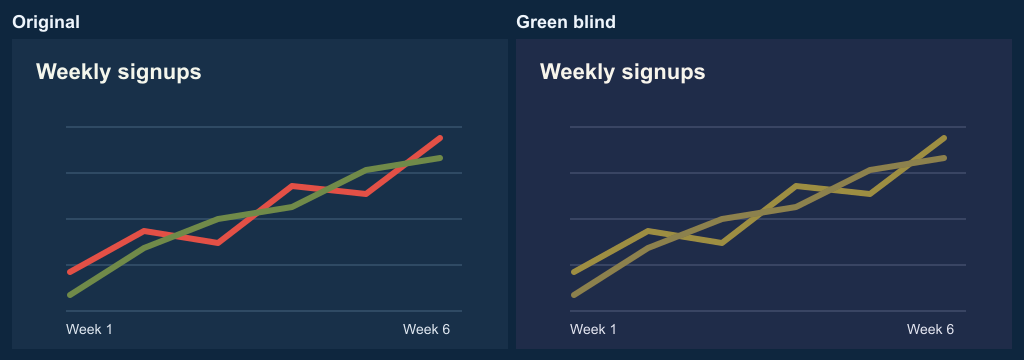
To reproduce the comparison below, open Color chart in the color blind checker and select Green blind. Look at the two lines where they pass close together. Then switch to Labeled chart to see how a second cue helps you follow them.
Color vision modelWCAG text contrast guidance
Frequently Asked Questions
Does the color blind checker upload my image?
Your browser reads and processes the file on your device. Replacing the image or reloading the page clears your previous image from the tool. To keep an image result, open or download it from the Image panel.
What can the simulated preview tell me?
It can show where colors in an image or palette move closer together under a modeled type of color vision. Screens, viewing conditions, and individual vision vary. Use the preview alongside text contrast checks and, where possible, feedback from people who use the design. The color blind checker offers a preview for one image or color set at a time.
Where can I check my own color vision?
Try the Daltonism Test to compare your answers to historical color-dot plates. It is an educational activity. For a clinical color vision assessment, ask an eye-care professional.
Can I check a very large screenshot?
The color blind checker accepts files up to 12 MB and scales images larger than 4 megapixels down for the preview and PNG export. If you need to see a tiny detail, crop that part of the original screenshot first. The file label shows the processed image dimensions.